
Know when a service goes down, slows down or answers differently.

Granit Golem tests your sites, APIs and databases, and compares each check with the previous 24 hours.

Six checks, no account needed.

1.68M
measurements recorded from September 4 to October 4, 2026
15
types of checks
9
signals compared with the previous 24 hours
0
agent to install

A service that is up is not always a service that works.

Availability 100% Response time
Drift detected It slows down Availability stays at 100% while the response time doubles.
GET /health 200 OK "status": "ok", "db": "up", "database": { "state": "up" }, "version": "2.4.1"
Structure changed It answers differently The status stays 200, but a field was renamed in the response.
Availability Consecutive failures 123 = threshold reached
Alert sent It goes down After the number of consecutive failures you set, the alert goes out.

What you see in the app.

  1. Availability

    Each check confirms that the service answers.

    An alert goes out after the number of consecutive failures you set. An SSL certificate is flagged before it expires.

    /projects/:id/dashboard
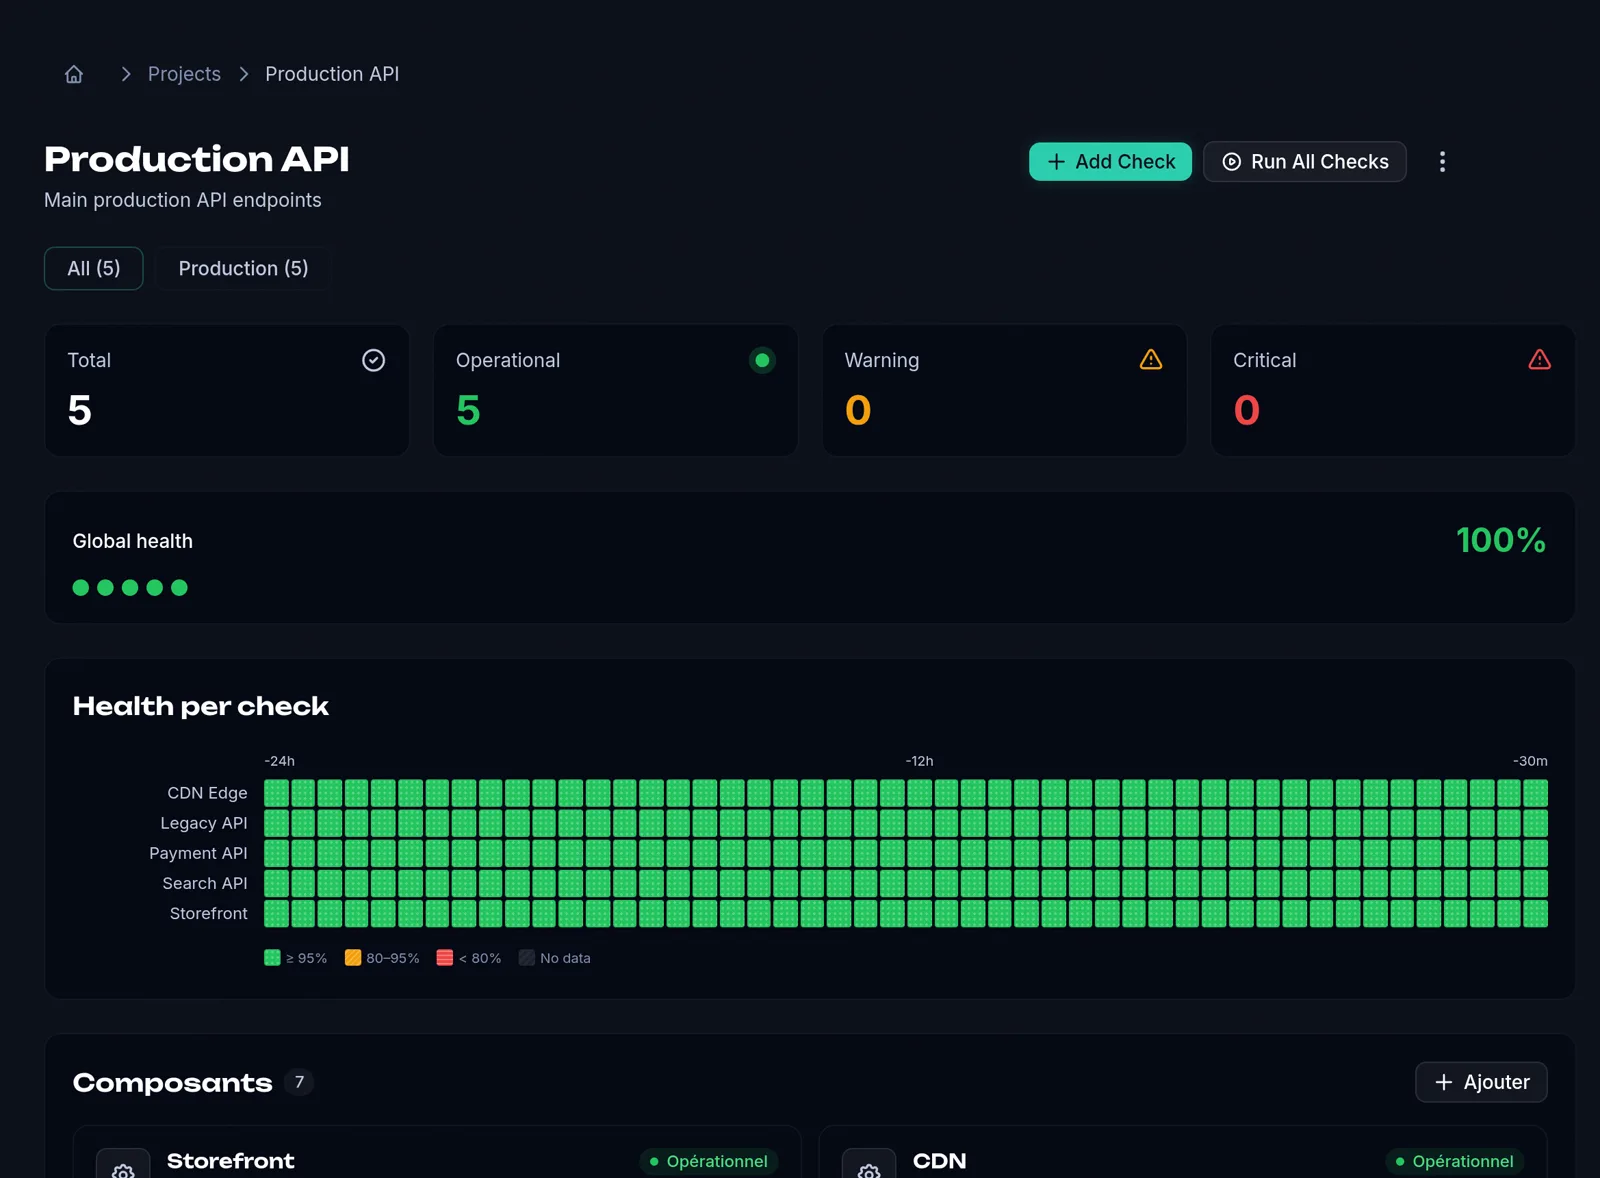
    A project dashboard: five healthy checks and the health of each over 24 hours
  2. Drift

    Each check is compared with the previous 24 hours.

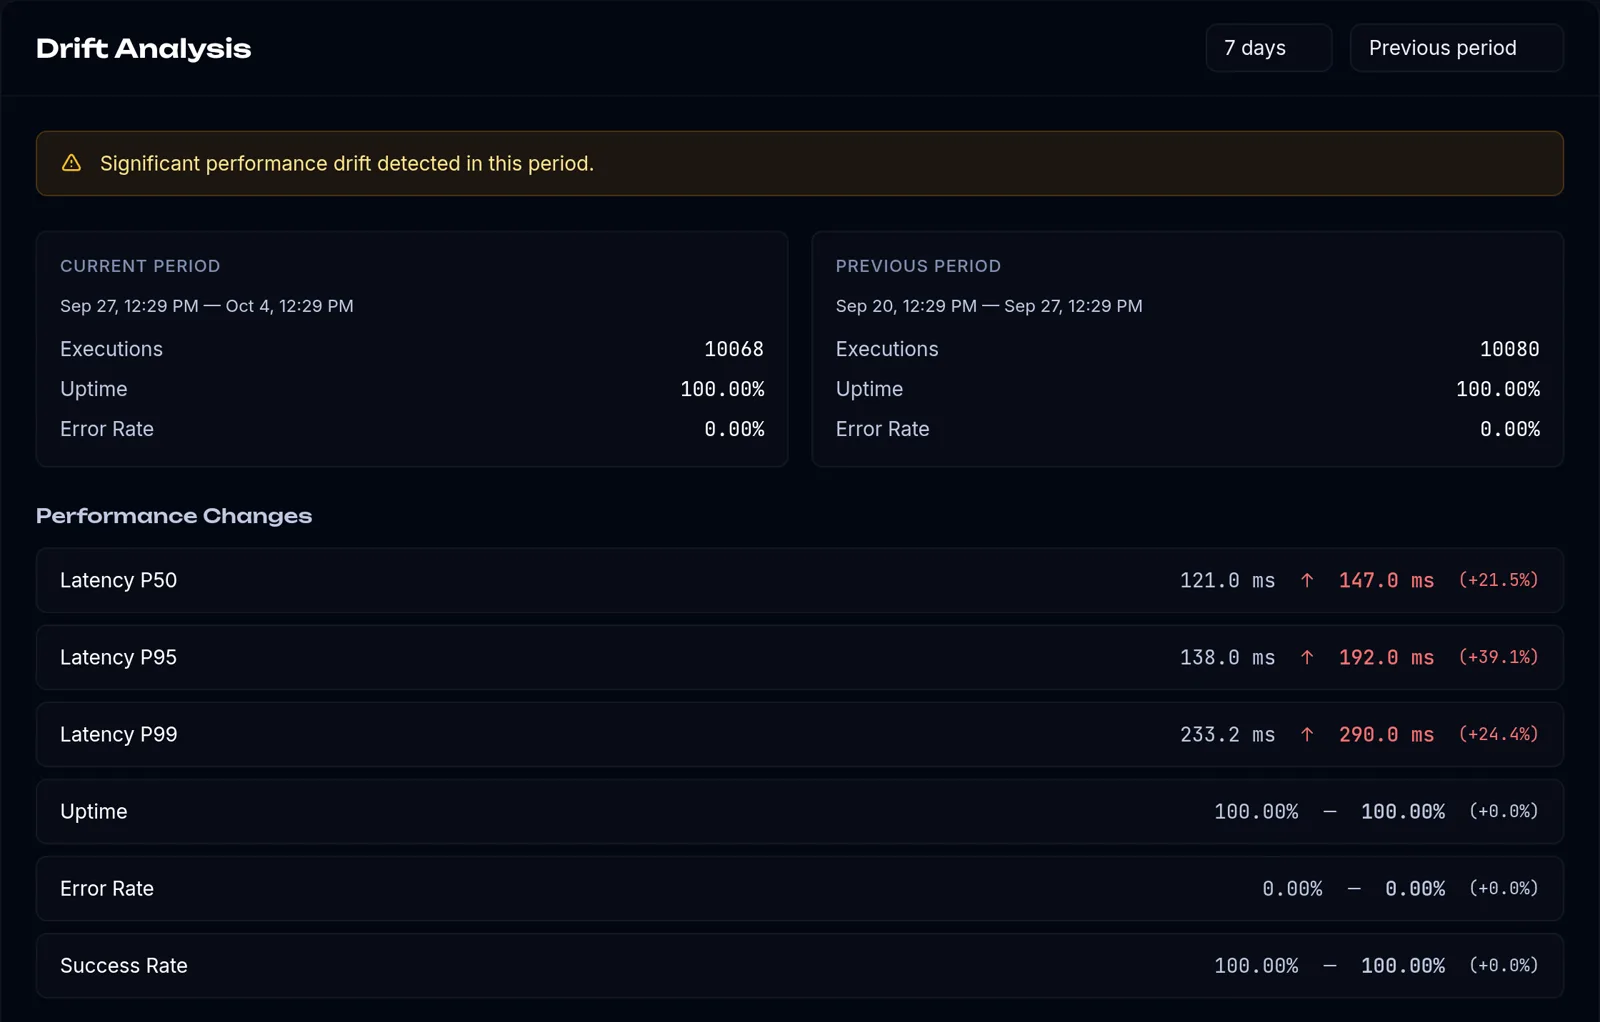
    Every 6 hours, Granit Golem compares 9 signals: p50, p95 and p99 latency, availability, error rate, success rate, response structure, HTTP status and headers.

    /projects/:id/checks/:checkId
    Drift analysis page, 7-day period selected: p95 latency goes from 138 to 192 ms compared with the previous week
  3. Alerts and status page

    Your team gets the alerts, your users see the status page.

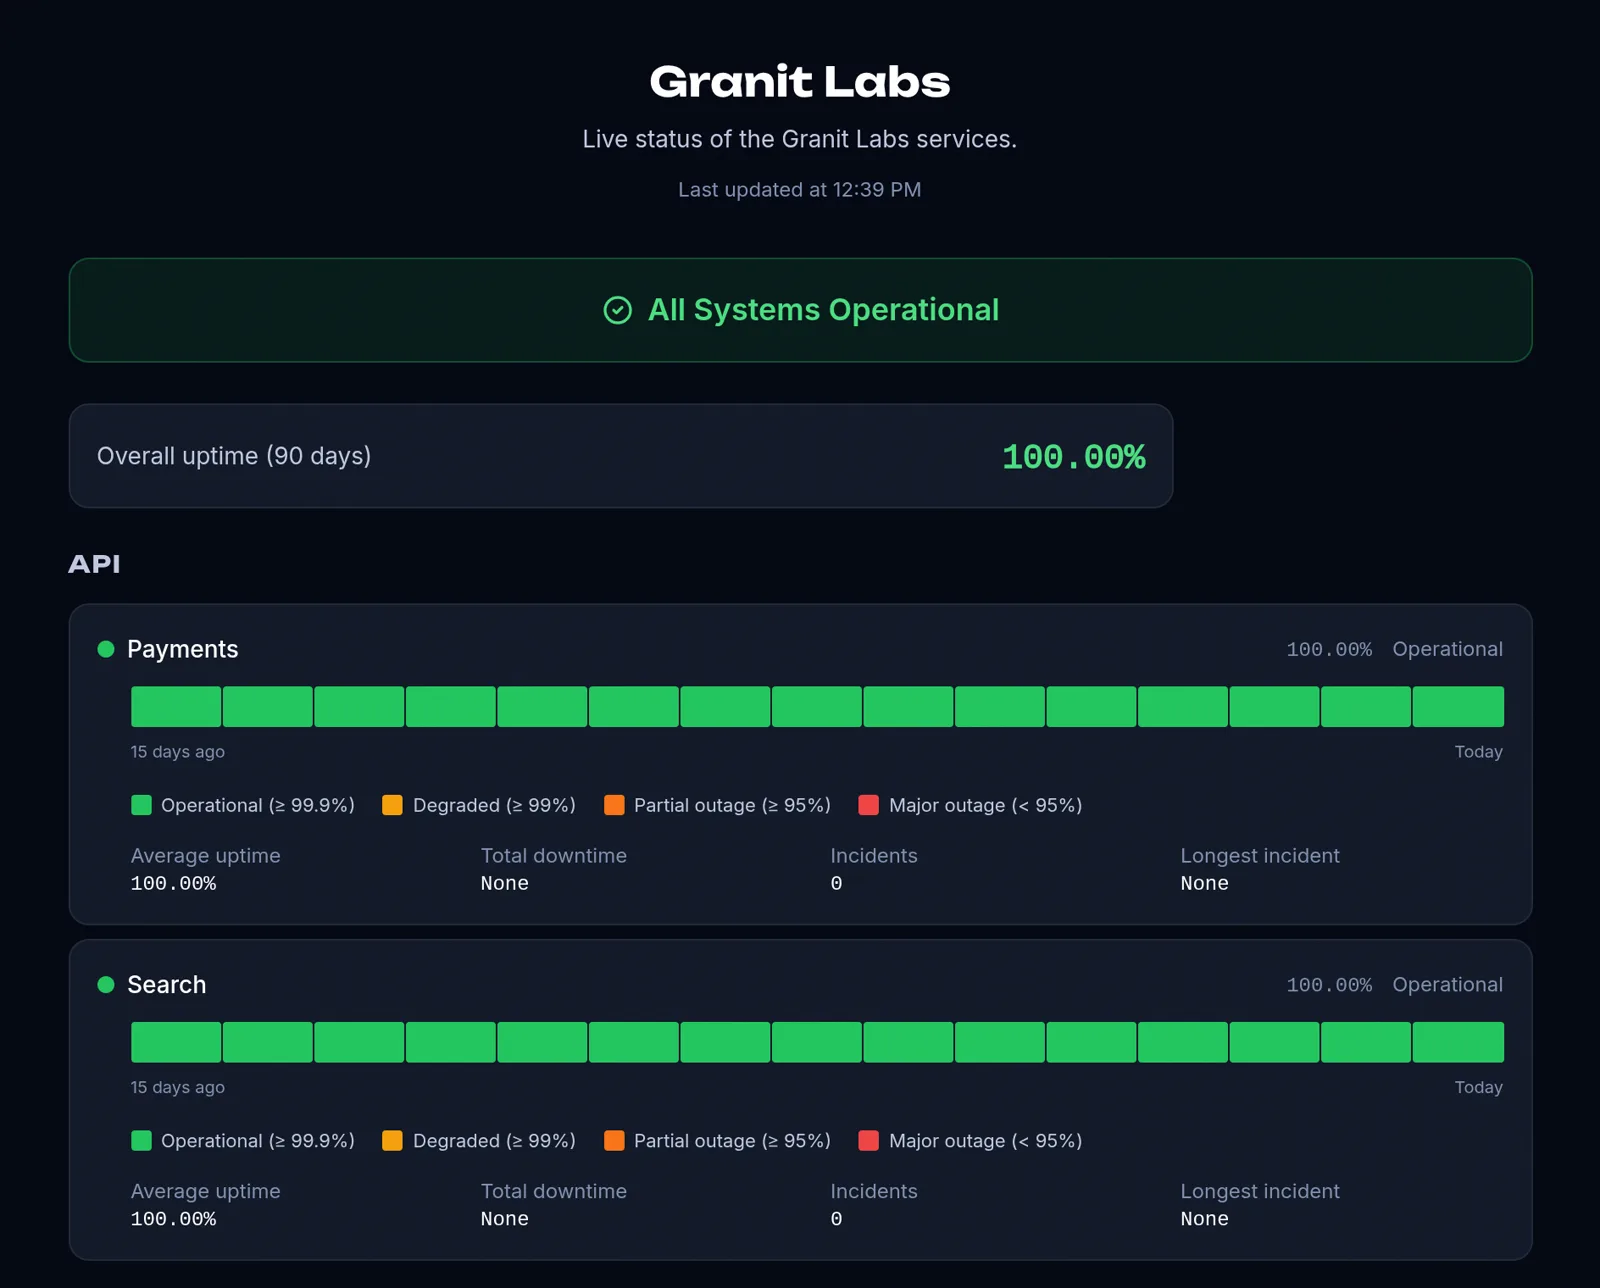
    Alerts go out by email, Slack, Discord, PagerDuty or webhook. A public status page shows the state of each service.

    /status/granit-labs
    Public status page: availability of each service over 15 days
  4. Overview

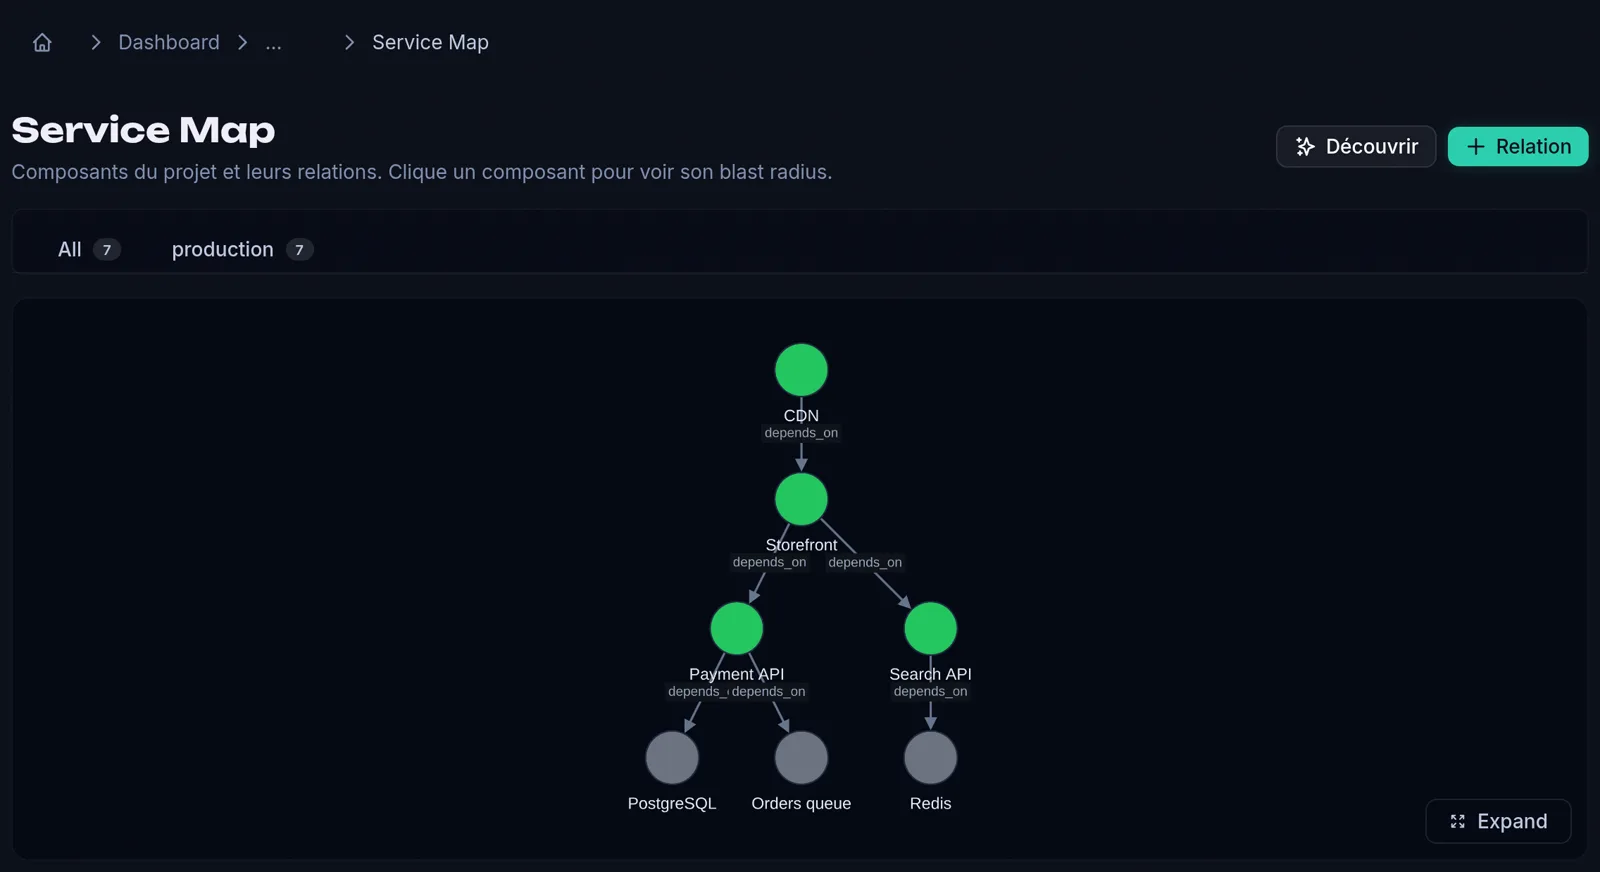
    The service map shows what depends on what.

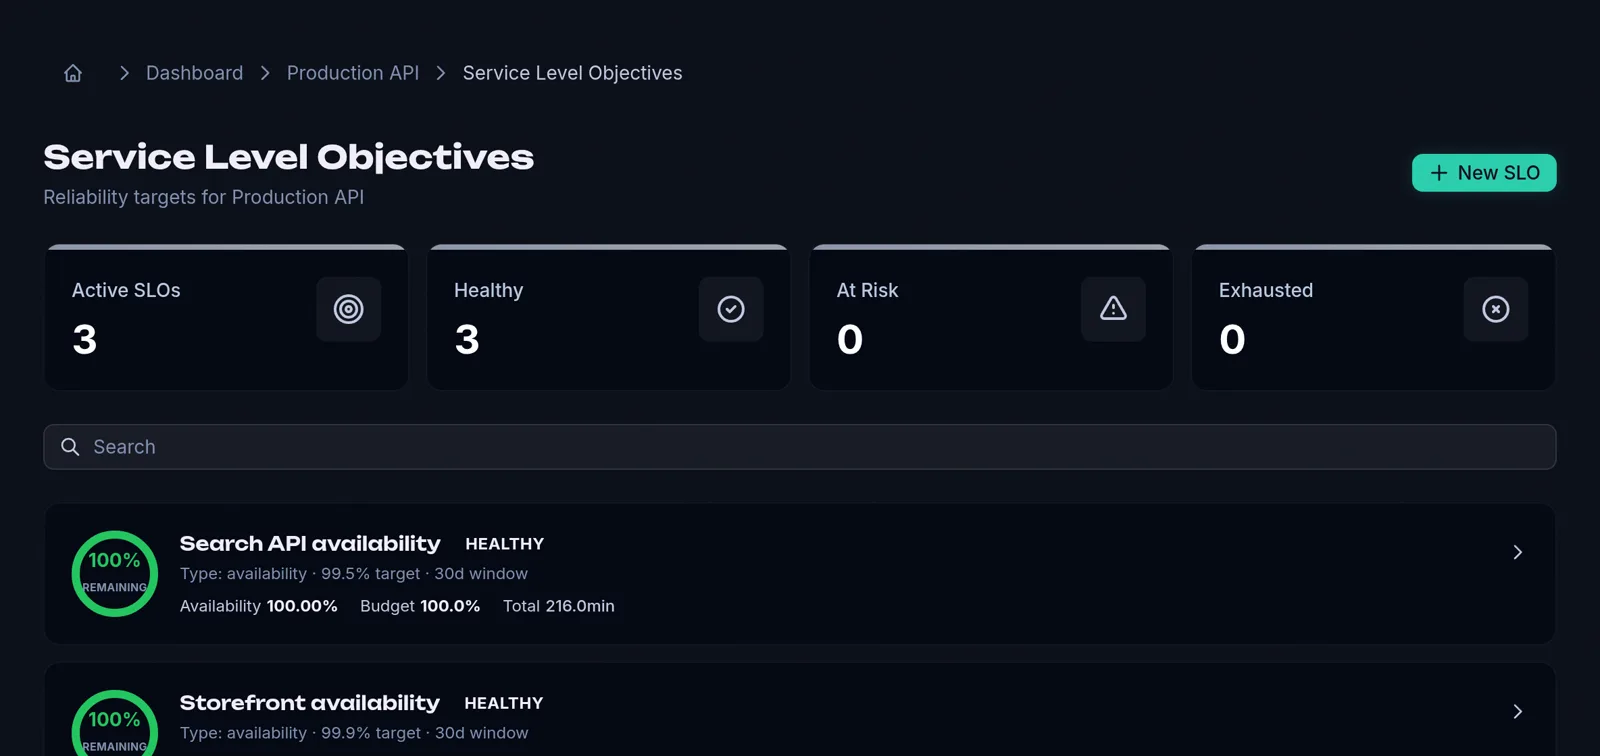
    You link your components and set SLOs: the app tracks the remaining error budget and how fast it runs out.

    /projects/:id/service-map
    Service map: the CDN leads to the storefront, which depends on the payment API and search
    /projects/:id/slos
    SLO list: three availability objectives and their remaining error budget
Create a free account

Screenshots of the app, demo data.

Two drifts that slip past a simple availability test.

Performance, real case

On September 24, 2026, the p95 of one of my services doubled.

From September 4 to 23, it stayed between 63 and 86 ms, apart from a 111 ms spike on the 19th. From September 24 to October 3, it stayed between 139 and 153 ms.

The service never stopped answering. The gap only showed when each day was compared with the ones before.

60 100 140 before Sept. 24: 63–86 ms alert on Sept. 25 at 3:31 a.m. Sep 4Sep 24Oct 3 60 100 140 before Sept. 24: 63–86 ms alert on Sept. 25 at 3:31 a.m. Sep 4Sep 24Oct 3
Daily p95 (UTC days, 1,440 measurements per day). Real measurements, service address hidden.
Drift 64 → 140ms p95 over the 24 hours before the alert, compared with the 24 hours before that
Stable 99.79% lowest availability during the drift
Alert 1 on September 25 at 3:31 a.m., Paris time
Duration 10days daily p95 of 139 ms or more

Content, demo data

The HTTP status stays 200 while the response has changed.

A renamed field breaks a client app without taking the API down. Granit Golem compares the structure of responses and the headers. With the blocking drift option, the check fails as soon as the structure changes.

GET https://pay.example.com/health HTTP status 200 → 200 Body structure, significant change "status": string- "db": string- "queue": { "lag_ms": integer }+ "database": { "state": string } "version": string Headers, significant change cache-control content-type- x-ratelimit-limit- x-ratelimit-remaining

When to use it.

  • After a release

    A release can slow a page down or change an API response without visibly breaking anything.

  • For an API others depend on

    Response structure and headers are compared from one day to the next.

  • For several sites or clients

    One project per client, with its environments and its public status page.

The film, in a minute and a half.

Reconstructed values, demo data.

What each kind of tool detects.

OutageSlowdownChanged responseNothing to install
Uptime tool yes partly, with a threshold or keyword to set partly, with a threshold or keyword to set yes
Observability (Datadog, Grafana…) yes yes partly, with a threshold or keyword to set no
Granit Golem yes yes yes yes

yes partly, with a threshold or keyword to set no

Granit Golem does not do APM and collects neither traces nor logs.

Fifteen types of checks.

Web and API 3
  • HTTP
  • SSL certificate
  • multi-step journey
Network 4
  • TCP
  • DNS
  • ping
  • SMTP
Databases and storage 6
  • PostgreSQL
  • MySQL
  • MongoDB
  • Redis
  • Elasticsearch
  • S3
ELK stack 2
  • Logstash
  • Kibana

Also in the app.

  • Heartbeats for scheduled jobs
  • Maintenance windows that pause checks
  • Checks grouped by environment
  • CSV export of executions
  • Weekly email report
  • Teams and invitations
  • Documented API, API keys, outgoing webhooks
  • Interface in French and English

Built in Nantes.

Portrait of Cédric Chariere Fiedler

Cédric Chariere Fiedler

Web and API architect, Nantes

I use Granit Golem on my own services.

  • Each organisation is isolated in the database, and your channel secrets are encrypted.
  • Known limit: a very slow degradation, a few percent per day, can go unnoticed.

Frequently asked questions.

How is it different from a classic uptime tool?

An uptime tool reports an outage, and a slowdown above a threshold you set. Granit Golem also compares each check with its own recent history.

Do I need to install anything?

No. Checks start from the Granit Golem servers, so a database must be reachable from those servers.

How many alerts will I get?

One per significant drift, not one per measurement. The September 24 case triggered only one.

Three steps to get started.

  1. Add a check

    A URL, a port or a database, at the frequency you choose.

  2. Pick your channels

    Email, Slack, Discord, PagerDuty or webhook.

  3. Let it run for 48 hours

    Drift detection starts as soon as two days of measurements are recorded.

Create a free account

Free during early access.

5
checks included

Included

  • Alerts
  • Status pages
  • SLOs
  • Service map

No credit card. Pricing is not set yet.

More than 5 checks, or several clients? Write to me.